The USDA has released the number of growers and sales in Floriculture during 2021.
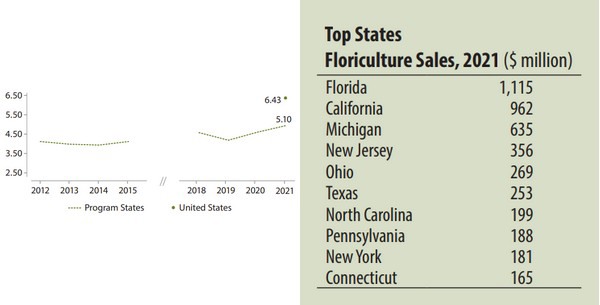
The number of floriculture producers totaled 9,558 in 2021. For the combined 17 states included in the program last year, the number of producers increased by 8%. The total value of sales across all floriculture crops totaled $6.43 billion. For the combined 17 states included in the program in 2020, the value increased by 6%.
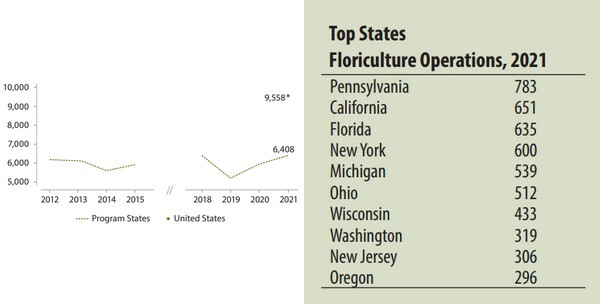
The survey anyway points out that care should be taken when comparing 2021 U.S. totals with the “Program States” totals from 2020 and prior years since fewer states contributed to the totals in the earlier years. More than 30 crops were added to the survey, further increasing program coverage across all crop categories. Also, in 2021, NASS began publishing sales as retail, wholesale, and total, rather than the previous practice of converting non-wholesale prices to a wholesale equivalent. This change provides estimates of price and value more directly related to the information provided by producers.
Going back to the results, The number of operations with hired workers totaled 6,759 in 2021. For the combined 17 states included in the program in 2020, the total increased by 7%. The average peak number of workers per operation was 16.9 nationally in 2021. For the 17 states included in the program in 2020, the average number declined from 18.8 to 18.5 per operation.
Looking at sales state by state, Florida had the highest sales, followed by California. Combined, these two states accounted for nearly one-third of all sales in the United States.
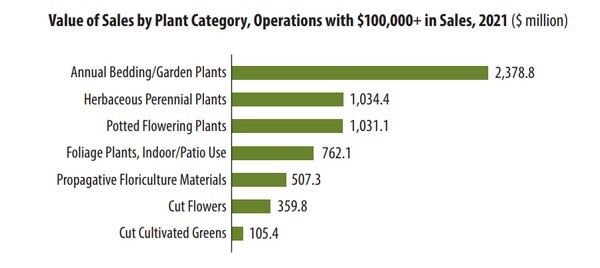
Sales of annual bedding/garden plants represented the largest total among all plant categories in 2021.
Access 2021 and earlier floriculture data through the Quick Stats database quickstats.nass.usda.gov
Source: nass.usda.gov