Wireless Value presented its wireless sensors for the first time at the GreenTech in Amsterdam. Before Covid, Bas Visser could already be found at fairs exhibiting his products. However, things have changed.
For instance, Bas is now a shareholder and director, together with Feike Oenema, a technical man from the very beginning. The past two years have certainly not been idle for the Dutch company. Besides an 'enormous' technical upgrade of the wireless sensors, a completely new data platform with, among other things, an 'easy-to-use growth model' for the grower has been developed.
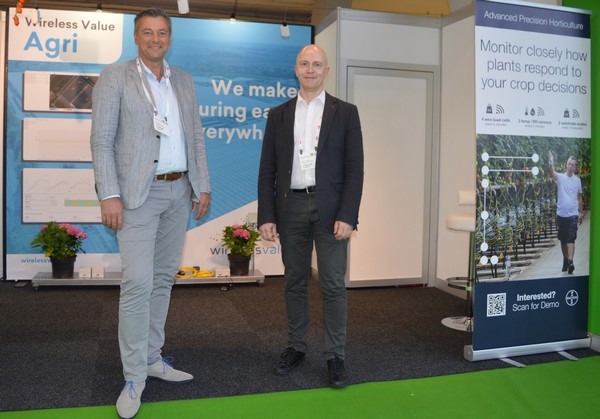
Bas Visser and Remy Croese of Wireless Value at GreenTech Amsterdam 2022
Growth model
"The data from the weight measurements that we take with our wireless plant scales can be combined with light, expressed in joules. On our platform, we bring both types of data together, which creates a growth model," says Bas. This was explicitly a wish of growers. "In order to further refine our technology and data platform, we started talking to growers. An important point in their feedback was that they wanted to have a reference on our platform in terms of weighing data based on an easy-to-fill-in growth model, a so-called ideal line."
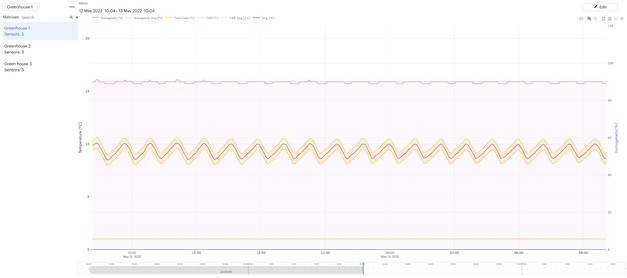
Homogeneity graph. Click here to enlarge.
On a daily basis, the grower can now see how their crop is doing in relation to the ideal line. "The grower does not have to wait for the chosen strategy to work out in the crop, for example, a crop that is too vegetative. As a grower, you want to avoid that. By measuring and interpreting the data properly, this can be done."
The current growth model in the online platform of Wireless Value, formerly AgriSensys, looks back in time and not yet in the future. "Although the latter is the goal we are working towards. At that point, you can start predicting, for example, what the grower's production will be in three days' time." For the time being, therefore, Bas does not want to speak of artificial intelligence. "What we offer the grower now is an easy-to-use and understand growth model."
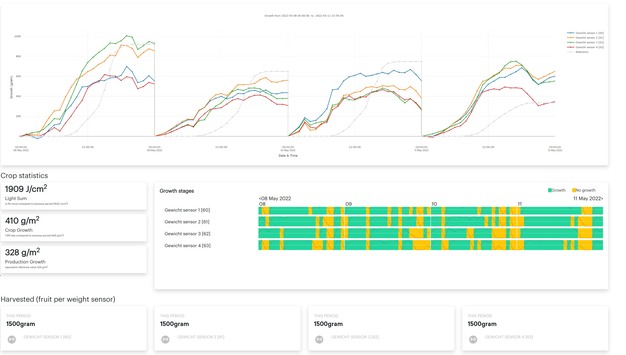
Growth model. Click here to enlarge.
3D overview
Another future step that is soon to come is displaying climate sensors in a 3D map using Google Maps. Bas points it out on the screen. "Look, at that moment, you can see where the sensors are and which sensor takes certain measurements at which place. In these overviews, you can compare temperature, humidity, and dew point."
The wireless climate sensors measure values such as temperature, relative humidity, CO2, temperature change in heat networks, PAR, and radiation. This data is sent to a base station, and from there, it is available in an online dashboard. "From there, the grower can see at a glance what is going on in the greenhouse."
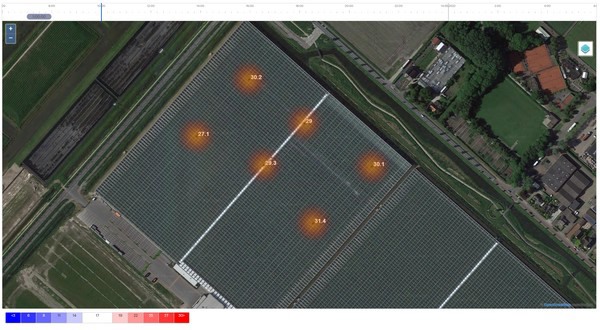
Digital map with the 3D sensor locations. Click here to enlarge.
Housing
The wireless scales for substrate mats with which Wireless Value has built up the necessary reputation are going 'pretty fast' at the moment, Bas is pleased to see. "In this way, the grower knows better what is happening with the slab. Start-up companies know our technique too. They use the wireless scales to learn about the effect of the adjustments they make to a crop." Users can also share the data generated by measuring with third parties if they wish.
A final development at Wireless Value is in the housing of the sensors. These are now made from recycled materials, Bas explains. "We no longer add plastic to the chain." Horticulture is a focus market for Wireless Value. "It already was, and it will remain so. The pharmaceutical industry is another focus market for us. For instance, we measure the temperature during blood transport from blood station to a laboratory, but also CO2 in stoves and the temperature in refrigerators and freezers."
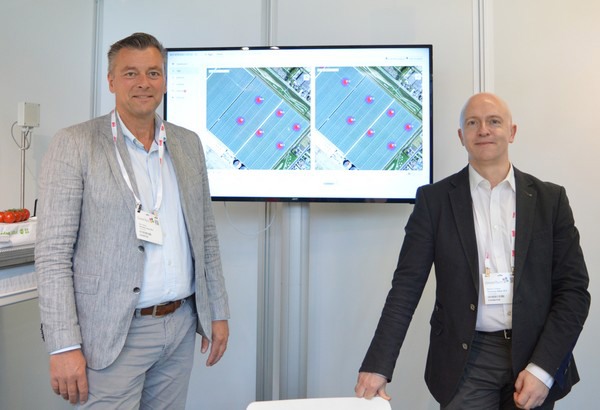
Bas and Remy at the digital map that will soon show sensor locations in 3D
For more information:
Bas Visser 
Wireless Value B.V.
[email protected]
www.wirelessvalue.nl


